
You've punched your numbers into a YouTube revenue calculator. The estimate pops up. You feel excited, deflated, or confused, maybe all three at once.
Here's what most calculators won't tell you: the number staring back at you is just the starting line. This post explains what that figure actually represents, how the math behind it works, and what it signals to the brands competing to reach the audience watching those videos.
Because YouTube revenue data isn't just relevant to creators. It's one of the most underutilized signals in influencer marketing. The CPMs, RPMs, and engagement patterns that determine a creator's paycheck are the same variables that determine whether a brand partnership delivers real ROI or burns budget on inflated metrics. According to DemandSage, the global median average CPM on YouTube is approximately $2.91, but that number spans dramatic variance: from $36.21 in Australia to $11.95 to $32.75 in the US. Understanding these baseline numbers helps you calibrate expectations before you interpret a creator's audience value or negotiate a sponsorship rate.
TL;DR
- YouTube revenue calculators provide estimates based on incomplete data and can't account for audience behavior, content niche, or monetization mix
- CPM (cost per thousand impressions) differs fundamentally from RPM (revenue per thousand views), and mixing them up distorts both creator expectations and brand valuations
- Ad revenue depends on viewer location, device type, ad engagement rates, and seasonal advertiser demand
- Premium content categories (finance, tech, business education) can generate CPMs 5 to 10x higher than entertainment or gaming
- Geographic audience composition affects earnings dramatically, with US viewers generating 3 to 8x more revenue than viewers from lower-CPM regions
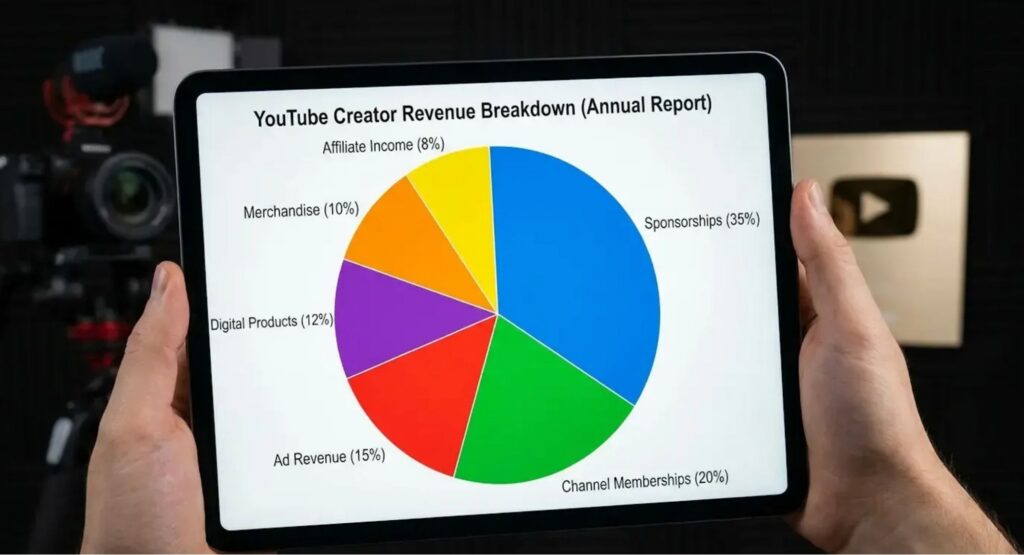
- Multiple revenue streams including sponsorships, memberships, and affiliate deals can exceed ad revenue by 200 to 400% for mid-tier channels
- For brands, these same variables determine the real value of a creator partnership, and generic calculator outputs miss most of them
Why Revenue Calculators Show You Half the Picture
Most YouTube revenue calculators operate on a single fatal assumption: that every channel behaves like the average channel in its subscriber range. Plug in a view count, apply a generic CPM estimate, and out comes a number. Clean. Fast. Wrong.
The problem isn't the math. It's that these tools can't see the variables that actually drive earnings: audience retention curves, viewer demographics, advertiser alignment, content classification status, or the percentage of views that actually generate monetized impressions. They're built for speed and simplicity, not accuracy.
For creators, that means misread expectations. For brands evaluating YouTube influencer partnerships, it means something more consequential: you're making budget decisions on data that systematically ignores the most important signals. Understanding influencer collaboration pricing requires going well beyond what any calculator surface.
The Data Gap Between Estimates and Reality
A YouTube revenue calculator works with three or four inputs at most: views, subscribers, maybe a niche category. YouTube's actual revenue algorithm simultaneously weighs dozens of signals.
The calculator doesn't know that 60% of a creator's viewers skip ads after five seconds. It can't see that the audience watches primarily on mobile during commute hours when ad rates dip. It has no visibility into whether viewers are logged into Google accounts (affecting targeting precision) or whether content triggers brand safety filters that limit the advertiser pool.
These aren't small rounding errors. They represent the difference between a $3 CPM and a $12 CPM on identical view counts.
Example: A productivity channel with 50,000 monthly views inputs numbers expecting $400 based on an $8 CPM estimate. Reality: 35% of their audience watches from India and Southeast Asia at lower CPMs, 20% uses ad blockers, and 15% of videos triggered limited ads due to background music flags. Actual monthly revenue: $180, less than half the projection. The calculator wasn't wrong about CPM rates. It just couldn't account for the variables that determine which views actually monetize and at what rate.
For a brand using a YouTube money calculator to estimate what a creator's audience is worth, the same blind spots apply, compounded by the fact that you're estimating someone else's audience, not your own.
The Monetization Mix Invisibility Problem
Ad revenue is one income stream. Calculators treat it as the only one.
Channels with 50,000 subscribers might generate $800 monthly from ads while pulling $3,200 from memberships, $1,500 from affiliate links, and $2,000 from sponsored integrations. The calculator shows you $800 and calls it done.
This matters for brands because it reframes how to think about creator valuation. A creator earning $6,500 total monthly income from a channel that shows $1,200 in estimated ad revenue isn't underperforming. They've built an audience with real commercial influence. The calculator just can't see it.
Breaking Down the CPM vs. RPM Confusion
CPM and RPM are used interchangeably in most creator conversations. That linguistic proximity creates expensive confusion, for creators estimating their income and for brands trying to understand what they're paying for.
CPM measures what advertisers pay per thousand ad impressions. RPM measures what a creator earns per thousand video views. The gap between them represents YouTube's revenue share, roughly 45%, plus the reality that not every view generates an ad impression. Viewers with ad blockers, viewers who exit before the ad loads, and videos partially demonetized due to content flags all produce views without revenue.
According to DemandSage, Google takes approximately 45% of what advertisers pay, leaving 55% to creators. That split is just the starting point, before accounting for non-monetized views, viewer behavior patterns, and content classification factors that further reduce what actually hits the creator's account.
| Metric | What It Measures | Who Uses It | Typical Range |
| CPM | Advertiser cost per 1,000 ad impressions | Advertisers, marketers | $2 to $35+ depending on niche |
| RPM | Creator revenue per 1,000 video views | Creators, channel analysts | $1 to $25 after YouTube's cut and non-monetized views |
| Monetized Playback Rate | Percentage of views that actually serve ads | YouTube's internal systems | 40 to 60% for most channels |
| Effective CPM | What advertisers actually pay after auction dynamics | Ad buyers | Varies by targeting precision |
Most revenue calculators ask for your CPM, then multiply it against total views. That projects gross ad spend, not creator earnings. A calculator showing $10 CPM times 500,000 monthly views and projecting $5,000 in revenue may reflect an actual RPM of $4.50, putting real earnings closer to $2,250. That's not a 10% miscalculation. It's a 122% overestimate.
For brands using a YouTube money calculator to benchmark what sponsorship rates should look like, this distinction matters. A creator quoting a partnership rate doesn't have to align their price to estimated ad revenue. They're pricing access to audience trust, which runs on a different scale entirely.
How YouTube Actually Calculates Ad Revenue
YouTube runs a real-time auction every time someone loads a video. Advertisers bid based on viewer demographics, watch history, device type, and content category. The highest bidder wins that specific impression. Revenue accumulates impression by impression, auction by auction, with rates fluctuating constantly throughout the day.
This means two viewers watching the same video generate different revenue depending on their profiles and the advertiser demand for their attention at that exact moment. YouTube doesn't pay per view. It pays per monetized playback, and only for portions of that playback where ads served and met minimum engagement thresholds.
Engagement Thresholds That Trigger Payment
You don't earn revenue when an ad appears. You earn it when the ad meets YouTube's engagement criteria. Skippable ads require the viewer to watch at least 30 seconds (or the full duration if shorter) or interact. Non-skippable ads require complete viewing. If the viewer skips at five seconds or closes the video, that impression generates no revenue.
The actual monetized playback rate for most channels runs between 40 and 60% of total views. Calculators assume 100%.
Example: A tech tutorial channel uploads a 12-minute video that gets 10,000 views. Expected revenue based on standard calculator output: full monetization across 10,000 views. Reality: 1,200 viewers use ad blockers, 800 close before the pre-roll completes, 2,400 skip mid-roll ads before the 30-second threshold, and 600 views come from embedded placements that block certain ad formats. Effective monetized views: 5,000. The creator's revenue is cut in half before CPM variation even factors in. This is precisely why surface-level metrics like raw view counts and subscriber numbers are insufficient for evaluating creator audience quality. The same 10,000 views on two different channels can represent completely different advertiser value, and completely different partnership ROI.

How Content Classification Affects Ad Eligibility
YouTube scans video content, metadata, and audience behavior to determine advertiser suitability. Videos flagged for limited ads still monetize, but they're excluded from brand-sensitive advertiser campaigns.
Profanity in the first 30 seconds, controversial topics, or audience demographics that skew young can limit the ad pool. Fewer competing advertisers means lower auction prices means lower CPMs. Identical view counts can generate 70% revenue variance based purely on how YouTube's systems classified the content for advertiser matching.
For brands evaluating influencer marketing for D2C brands or any performance-sensitive category, content classification history is a legitimate due diligence check before committing to a creator partnership.
The Hidden Variables That Swing Earnings by 300%
Revenue calculators ask for views and maybe a niche category. YouTube's payment algorithm weighs dozens of variables simultaneously, and the combinations create enormous earning disparities between channels with similar surface metrics.
Here's what's working in the background and why it matters to anyone evaluating a creator partnership:
Session duration and platform loyalty. YouTube rewards content that keeps viewers on the platform. Videos that retain viewers and extend their session drive more ad placements, better algorithmic distribution, and preferential inventory access. A creator whose audience stays and watches generates more real advertiser value than one generating equivalent views with high bounce rates.
Logged-in user concentration. Advertisers pay premiums for precisely targeted impressions. Viewers logged into Google accounts provide rich targeting data including search history, purchase behavior, and YouTube watch patterns. Anonymous viewers offer minimal targeting data, and advertisers bid less for those impressions. A creator with 80% logged-in viewership commands significantly higher CPMs than one with 40% logged-in audience, even at identical view counts.
Device mix. Mobile viewers generate lower CPMs than desktop viewers in most categories. Connected TV viewers often generate the highest CPMs because they're watching in lean-back mode with limited ability to skip or block ads. Your audience's device distribution directly impacts the accuracy of any revenue calculator estimate.
Advertiser performance history. Advertisers track what happens after viewers see their ads on specific creator content. If a creator's audience consistently clicks and converts, advertisers bid more aggressively for future placements. This builds an invisible performance reputation that inflates CPMs over time, and it's entirely invisible to generic calculators.
This is the distinction between surface reach and verified audience quality, the same distinction that separates getting started with influencer marketing on gut instinct from building partnerships on data.
Hidden Revenue Variable Audit Checklist (for brand marketers evaluating creator partnerships)
- Ask for actual RPM data, not estimated CPM. RPM reflects real per-view earnings after all variables.
- Review geographic breakdown. What percentage of views come from Tier 1 markets (US, UK, Canada, Australia)?
- Check device distribution. What percentage of views come from connected TV vs. mobile?
- Assess content classification. Any history of limited ad status on videos?
- Review average view duration as a percentage of video length. Retention above 50% signals audience quality.
- Compare RPM across content types to identify which formats drive premium advertiser demand.
- Ask for YouTube Studio screenshots of actual Revenue data, not calculator estimates.
Content Categories That Command Premium Ad Rates
Not all YouTube content generates equivalent advertiser demand. The gaps are substantial, and they should directly inform how brands evaluate creator partnerships and negotiate rates.
According to Influencer Marketing Hub, finance and business education channels often see RPMs ranging from $10 to $25, while entertainment and gaming channels typically generate $2 to $8 RPM. That's a 3 to 10x difference in per-view value. A finance creator with 100,000 monthly views can earn more than an entertainment creator with 500,000 views.
| Content Category | Typical CPM Range | Typical RPM Range | Audience Value Driver |
| Finance/Investing | $12 to $35 | $8 to $25 | High customer lifetime value, purchase intent |
| Business/SaaS | $10 to $30 | $6 to $20 | Decision-makers with budget authority |
| Technology | $8 to $22 | $5 to $15 | Affluent early adopters, tech buyers |
| Health/Medical | $8 to $18 | $5 to $14 | Health decision-makers, insurance relevance |
| Real Estate | $7 to $20 | $4 to $13 | High-value transaction audiences |
| Education | $5 to $15 | $3 to $10 | Learning intent, career development |
| Lifestyle/Fashion | $4 to $12 | $2.50 to $8 | Discretionary spending audiences |
| Gaming | $2 to $8 | $1.50 to $5 | Volume-based advertising model |
| Entertainment/Vlogs | $2 to $7 | $1.50 to $4.50 | Mass market reach |
What these ranges don't capture: the creator who built an audience of financial advisors versus one who attracts college students researching their first credit card. Both make finance content. Their CPMs might differ by 400%. Category benchmarks are starting points. Audience composition determines where a specific channel lands within that range, which is exactly why verification and scoring matter more than raw category assignment. For brands in finance, healthcare, automotive, or SaaS investing in YouTube influencer marketing, partnering with creators in misaligned categories wastes both the CPM premium those audiences command and the trust those creators have built. The difference between influencers and UGC creators also plays into this: category expertise and authentic authority aren't interchangeable, and the revenue data reflects it.

Audience Geography and Why It Matters More Than Subscriber Count
A channel with 20,000 subscribers and 80% US/UK/Canadian traffic will typically outperform a channel with 50,000 subscribers and primarily Southeast Asian traffic by 200 to 400% on revenue. Geographic distribution affects CPMs more dramatically than almost any other variable because advertiser budgets concentrate in high-GDP markets with strong e-commerce infrastructure.
US viewers generate average CPMs of $8 to $15. UK viewers generate $6 to $12. Indian viewers typically generate $0.50 to $2. The arithmetic is unambiguous.
Example: Two personal finance channels both upload budgeting content. Channel A creates "How to Budget on Any Income," a universal principles video that gets 80,000 views, with 25% from the US, 15% from the UK, and 60% from India and Southeast Asia. RPM: $3.20. Channel B creates "Budgeting for Bay Area Tech Workers: Managing $120K Salaries," which gets 12,000 views with 85% from the US. RPM: $18.50. Channel B earns $222 from 12,000 views. Channel A earns $256 from 80,000 views. Channel B generated 85% of Channel A's revenue with 15% of the traffic.
For brands, this example reframes the subscriber count obsession entirely. A creator with 15,000 US-concentrated, high-intent subscribers in the right content category is worth more to most enterprise advertisers than a creator with 80,000 globally distributed, low-CPM viewers. The YouTube money calculator showing the second creator's higher subscriber count is measuring the wrong variable.
Tier 1 market concentration (US, Canada, UK, Australia, Germany, Scandinavia) is one of the most important inputs in creator valuation, and it's one that almost no calculator captures. This is the kind of audience intelligence that distinguishes platforms built for influencer marketers from spreadsheet-based guesswork.
The Multi-Revenue Model That Changes Partnership Valuation
Ad revenue is one income stream. For established creators, it's often not the primary one.
Channel memberships, affiliate commissions, Super Chat, digital products, and sponsored integrations combine to produce total monthly income that can exceed ad revenue by 300 to 500%. According to creator earnings data from DemandSage, YouTube has also introduced Shorts-specific monetization. Creators with 1,000+ subscribers and 10 million valid Shorts views over 90 days now qualify for Shorts bonuses, with some smaller channels reporting $100 to $300 monthly from Shorts alone.
Marques Brownlee publicly disclosed in a podcast interview (reported by Influencer Marketing Hub) that sponsorships and brand deals now represent 60% of his income, with AdSense at 30%. Nine years earlier, AdSense was 90%. That trajectory is the rule for established creators, not the exception.
What this means for brands using a calculate YouTube money approach to set partnership rates: you're not buying a creator's ad revenue share. You're buying their relationship with an audience. The creator earning $6,500 total monthly from a channel showing $1,200 in calculator-estimated ad revenue has built audience trust worth far more than the ad market reflects.
Sponsored content and direct brand partnerships bypass YouTube's revenue share entirely. Rates are negotiated on audience size, engagement, and niche relevance, and they vary enormously. A finance creator with 25,000 subscribers may command $3,000 to $8,000 per sponsored video. A gaming creator with 100,000 subscribers may receive $1,500 to $3,000 for equivalent deliverables. The finance creator's audience is worth more per person to the advertiser because of what those viewers are likely to buy.
Understanding how to make money on YouTube at scale, for both creators and the brands partnering with them, comes down to this: the audience relationship is the asset, and ad revenue is just one signal of its value.
How Brands Should Read YouTube Revenue Data
The YouTube revenue calculator is a creator tool that brands have started using for partner evaluation. That repurposing creates predictable blind spots.
When you use a generic calculator to estimate a creator's earning potential as a proxy for audience value, you're inheriting all the assumptions that make those tools unreliable for creators in the first place, then adding the additional variable of assessing someone else's channel rather than your own.
What to actually look at when evaluating a YouTube creator partnership:
RPM, not CPM. Ask creators for actual RPM data from YouTube Studio. RPM reflects real per-view earnings after YouTube's cut, non-monetized views, and all the variables that calculator CPM estimates ignore. A creator sharing their actual RPM is giving you verified performance data. One sharing a calculator output is giving you a projection.
Monetized playback rate. The percentage of views generating ad revenue tells you how engaged and authentic the audience is. Low monetized playback rates, below 40%, can signal audience quality issues that matter for sponsorship conversions too.
Geographic concentration. Tier 1 market concentration isn't just a revenue variable. It's an audience quality indicator. For brands selling products in the US market, a creator with 70% US traffic is worth more than one with 20% US traffic at three times the subscriber count.
Content classification history. Creators with recurring limited ad status on their videos have content that advertisers, including brand sponsors, may want to avoid for brand safety reasons. This isn't about penalizing creators. It's about alignment.
Watch time and retention data. Average view duration as a percentage of video length reflects whether the audience genuinely engages with content or clicks away after seconds. High retention correlates with the kind of trust that converts brand messaging into action.
None of this data requires a calculator. It requires asking the right questions and knowing what the answers mean. The best influencer marketing platforms surface this data automatically so brands aren't relying on self-reported creator metrics to make five-figure partnership decisions.

What Verified Audience Intelligence Actually Looks Like
The gap between what a YouTube revenue calculator shows and what a creator's audience is actually worth to a brand is where most influencer marketing budget gets lost.
Generic calculators can't verify whether a creator's subscribers are real. They can't score alignment between a creator's audience and a brand's customer profile. They can't tell you whether a creator's content style matches your brand's communication goals or whether their audience is positioned to act on your category's messaging.
Verification, alignment scoring, and audience intelligence are what separate disciplined influencer investment from educated guessing.
True Follower metrics, verified audience authenticity distinguishing real engaged viewers from inflated counts, give brands a foundation that no calculator provides. SPIRRA's True Follower technology detects fake accounts, bot engagement, and purchased interactions with 99.7% accuracy, meaning every impression you're paying for in a creator partnership is a real one. Algorithmic brand alignment scoring across content style, audience demographics, and historical engagement patterns replaces the instinct-based creator selection that leads to misaligned partnerships. And real-time performance data replaces retroactive calculator estimates with forward-looking campaign intelligence.
The creators who build sustainable YouTube income understand their real audience, not the audience their subscriber count implies. The brands that build sustainable YouTube influencer programs operate on the same principle: verified data, aligned partnerships, and measurement frameworks that capture what actually moves their business.
For brands managing serious influencer investment, the question isn't what a revenue calculator says a creator should be earning. It's whether the audience that creator has built is the one your brand needs to reach, and whether you have the intelligence to know the difference before you sign the contract.
SPIRRA's platform is built to answer those questions at scale: 19 million influencers, 150 data points per creator, and AI-powered scoring that makes audience verification and brand alignment measurable rather than assumed. If your YouTube influencer strategy is running on calculator estimates instead of verified audience intelligence, request a demo to see what the data actually shows.