
You've run an Instagram engagement rate calculator on a creator you're considering for a partnership. A percentage pops up. It looks acceptable, maybe even strong. You feel like you have a signal.
Here's the problem: most people using an instagram engagement rate calculator are measuring a metric that doesn't tell them what they actually need to know.
We obsess over percentages without understanding what drives them. We compare creators against industry benchmarks that were never designed for our specific audience or campaign goals. And we make partnership decisions based on a number that might be completely irrelevant to downstream brand performance.
The real story isn't in a creator's overall engagement rate. It's in the patterns hiding underneath it, and whether those patterns align with what your brand is actually trying to accomplish.
TL;DR
- Standard engagement rate calculators give you a single percentage that obscures more than it reveals about creator-audience relationships and brand fit
- Tracking engagement by content type, time windows, and audience segments provides the actionable intelligence that overall rates can't
- Instagram's algorithm updates have fundamentally changed what engagement metrics mean, making historical comparisons misleading
- Follower count creates a mathematical disadvantage in traditional engagement calculations that penalizes growth and distorts creator valuation
- Save rates and engagement velocity often predict content resonance and partnership conversion better than likes and comments combined
- For brands, custom engagement frameworks aligned with specific campaign goals beat generic industry benchmarks every time
Why Standard Engagement Rate Formulas Miss the Point

Alt text description: Instagram engagement rate calculator formula breakdown
Most instagram engagement rate calculator tools use the same basic formula: total engagements divided by follower count, multiplied by 100. This gives you a percentage. The problem is that this single number treats all engagement equally, ignores timing, and assumes your entire follower base sees every post. None of these assumptions reflect how Instagram actually works today.
The basic engagement rate tells you something happened, but it won't tell you why it happened, who made it happen, or whether it's the kind of engagement that moves a brand's audience toward a purchase decision. You end up with a metric that's technically accurate but strategically useless for evaluating influencer partnerships at any meaningful level of precision.
The engagement rate calculation brands rely on was designed for a simpler platform. What matters now is disaggregating that number into the signals that actually predict partnership performance.
| Engagement Rate Component | What It Measures | What It Misses |
| Total Engagements | All interactions combined | Quality and type of interaction |
| Follower Count | Total audience size | Active vs. inactive followers |
| Time Window | Usually 24 hours or lifetime | When engagement actually happened |
| Engagement Types | Likes, comments, saves, shares | Which actions drive your goals |
| Content Format | All posts averaged together | Performance by Reels vs. static posts |
The Math Problem With Averaging Everything Together
Your engagement calculator spits out 3.2%. What does that number actually mean?
It means that if a creator posted 10 times this month and those posts got varying levels of interaction, the average sits at 3.2%. But one post might have hit 8% while another barely scraped 0.5%. The average hides the outliers, and those outliers are where the insights live.
You can't make a confident partnership decision on what you can't see clearly. When you compress all content performance into a single percentage, you lose the ability to identify which content types, topics, and audience behaviors are actually driving results. The carousel that got saved 400 times is averaged in with the generic quote graphic that got 12 likes, and both get treated as equivalent data points.
Example: A marketing consultant posts five times per week. Her tutorial carousels consistently hit 6 to 8% engagement rates with high save rates. Her motivational quote graphics struggle at 1 to 2%. Her overall engagement rate shows 4.5%, which looks acceptable. A brand reviewing only the aggregate number would find nothing concerning. But the engagement rates broken down by content type reveal that eliminating the underperforming content entirely would push her average to 7%, and more importantly, her tutorial audience is the one that asks detailed questions, saves posts for reference, and takes the kind of deliberate action that converts on brand partnerships.
Brands conditioned to chase higher percentages without asking what those percentages represent are optimizing for the wrong variable. A 5% engagement rate from low-intent engagement on misaligned content is not equivalent to a 3% rate from a highly qualified audience actively researching a purchase decision.
Why Your Follower Count Shouldn't Be the Denominator
Here's a structural flaw in standard engagement calculations that brands rarely think about: they mathematically penalize creators for growing their audience.
A creator gains 1,000 new followers this month. Their engagement rate drops, even though their absolute engagement numbers went up. The calculator doesn't account for the fact that new followers haven't developed a relationship with the content yet, or that Instagram won't show posts to all new followers immediately.
This denominator problem is precisely why engagement rate alone is unreliable for identifying the right influencers for your brand. The denominator (follower count) keeps growing while the numerator (engagements) doesn't scale proportionally because reach doesn't work that way. You're measuring performance against people who may have never seen the content.
The False Precision of Industry Benchmarks
Every analysis of Instagram engagement rates includes a chart of benchmarks. Influencers should aim for 3 to 6%. Brands typically see 1 to 3%. Micro-influencers can expect 5 to 10%.
These numbers feel authoritative. They aren't.
Industry benchmarks aggregate data across thousands of accounts with different audiences, content strategies, posting frequencies, and goals. They're descriptive statistics about what happened historically, not targets that indicate whether a specific creator is the right fit for a specific brand's campaign objectives.
What is a good engagement rate on instagram? The answer is: it depends entirely on who is engaging and whether those people are the audience your brand needs to reach. A creator with 2% engagement from your exact target customer profile outperforms one with 8% engagement from an unrelated audience every time.
The Three Engagement Metrics You're Not Tracking (But Should Be)
While most evaluations fixate on overall engagement rate, three specific metrics provide substantially more value for brand partnership decisions: engagement rate by follower segment, engagement rate by content format, and engagement rate by traffic source. These disaggregated metrics reveal patterns that get buried in aggregate calculations, and they transform engagement tracking from a report card into a decision-making tool.
Engagement Segmentation Audit Checklist (for evaluating a creator before committing to a partnership)
- Export the creator's last 30 posts with engagement data
- Categorize each post by format (Reel, carousel, single image)
- Tag each post by primary topic or theme
- Note the posting day and time for each
- Calculate engagement rate separately for each category
- Identify the top 3 performing combinations (format plus topic plus timing)
- Identify the bottom 3 performing combinations
- Compare which content types align with your brand's category and message
- Document whether high-performing content overlaps with your campaign objectives
- Use this breakdown as a creator scorecard, not just the aggregate percentage
Alt text: Content format engagement comparison chart
Engagement Rate by Follower Cohort
Not all followers are created equal, and engagement rate should reflect that.
Followers who joined a creator six months ago behave differently than those who followed last week. Your engagement rate calculator doesn't distinguish between them, but brand marketers should. A creator whose long-term audience is highly engaged has built real trust. A creator whose engagement is driven primarily by new followers experiencing a honeymoon period presents a very different partnership risk profile.
Tracking engagement by cohort reveals whether a creator retains audience attention over time or repeatedly acquires and loses it. For brands making long-term partnership investments, that distinction determines whether you're building lasting brand equity with an audience or renting temporary attention.
Engagement Rate by Content Format
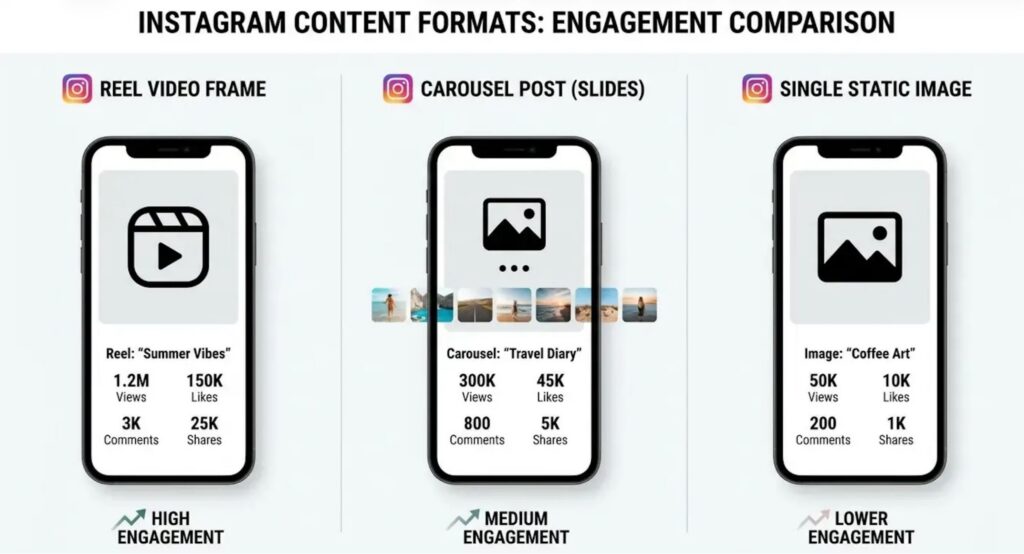
Your instagram engagement rate calculator gives you one number for all posts. But Reels perform differently than carousels, which perform differently than single images. Calculate engagement rates separately for each format and you get actionable intelligence on where a creator's audience actually lives.
A creator with an overall engagement rate of 4% might be hitting 7% on carousels and 2% on static posts. If your brand needs content that drives saves and reference behavior, that creator's carousel performance is the number that matters. You need to know which format their audience responds to before you spec the deliverables.
Example: A fitness creator analyzes her content performance by format. Her workout Reels average 12,000 plays and 4% engagement, mostly likes and quick comments. Her nutrition carousels average 2,000 impressions and 6% engagement, with high save rates and detailed questions in comments. Her overall engagement rate is 4.8%. A brand selling a nutrition program would generate very different partnership ROI from each format, even at the same sponsorship rate. The carousel audience is 5 times more likely to engage with nutrition-specific purchase decisions. The format breakdown is the insight. The overall rate is noise.
Engagement Rate by Traffic Source
Instagram provides data on whether engagement came from followers, hashtags, the Explore page, or other sources. Each source has different strategic implications for brands.
Follower engagement measures how deeply a creator connects with their existing audience. Explore page engagement indicates algorithmic amplification to people outside the creator's network. Shares and saved-post traffic reveal content with staying power beyond the initial posting window.
For brands finding influencers on Instagram, this traffic source breakdown reveals whether a creator's audience is loyal and developed or algorithmically driven and transient. Loyal audiences convert. Algorithmic audiences browse.
How Algorithm Changes Made Your Historical Data Useless
Instagram's algorithm has undergone fundamental changes that make engagement rate comparisons across different time periods misleading. The shift from chronological feeds to algorithmic ranking, the introduction and prioritization of Reels, and modifications to how reach is distributed have all altered what engagement rates represent at a structural level.
A 5% engagement rate in 2020 meant something different than a 5% engagement rate today because the underlying mechanics of content distribution changed. Evaluating creators based on historical benchmarks or year-over-year comparisons ignores this reality entirely.
| Algorithm Era | Primary Distribution Model | Key Engagement Signals | Typical Reach % |
| 2016 to 2017 | Chronological timeline | Likes, comments | 40 to 60% of followers |
| 2018 to 2019 | Interest-based ranking | Likes, comments, saves | 20 to 40% of followers |
| 2020 to 2021 | Engagement prediction | Saves, shares, time spent | 10 to 25% of followers |
| 2022 to present | Entertainment focus, Reels priority | Plays, completion rate, shares | 5 to 15% of followers |
The Reach Distribution Shift
Instagram now shows posts to a small percentage of followers first, measures engagement, then decides whether to expand distribution. This fundamentally changes what engagement rate measures. Creators are no longer being evaluated on how their content performs with their full audience. They're being evaluated on how it performs with the slice of their audience Instagram chose to show it to first.
This means engagement rate is now partially a measure of how well Instagram's sample audience represents the creator's full audience. That's a significantly different metric than what the industry was tracking three years ago, and any evaluation framework that doesn't account for this is working from an outdated model.
When Reels Changed Everything
The introduction of Reels didn't just add a new content format. It restructured how Instagram allocates distribution resources, which means less reach for everything else. A creator's static post engagement rate might decline not because their content quality dropped but because Instagram is systematically showing it to fewer people.
For brands evaluating ig engagement rate calculator outputs across a creator's historical content, this context is critical. A drop in engagement rate over 18 months may reflect platform-level changes, not creator quality issues or audience deterioration. Applying current performance standards to historical data creates false negative evaluations on creators who are actually well-positioned.
The Engagement Signal Hierarchy Keeps Evolving
Instagram doesn't treat all engagement equally, and the weighting keeps changing. Saves now carry heavy algorithmic weight. Comments matter, but Instagram discounts low-quality comment patterns. Watch time and completion rate emerged as crucial signals for video content.
Your engagement rate calculator adds up all these signals and divides by followers. But Instagram's algorithm weights them differently, and those weights have changed repeatedly. A creator who optimized for the signals that mattered in 2022 may look weaker on aggregate metrics today while actually maintaining stronger authentic audience relationships than their numbers suggest.
Audience Quality vs. Engagement Quantity
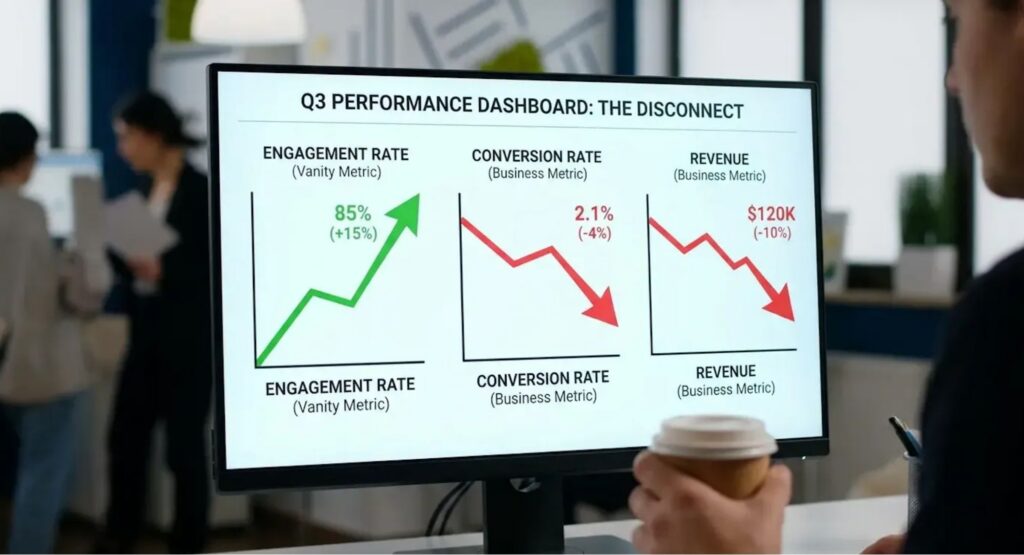
High engagement rates mean nothing if the people engaging aren't aligned with your brand's target customer. You can find creators with impressive engagement percentages that have been built by attracting audiences that interact frequently but never convert, never purchase, and never become the customers you're trying to reach.
This is the trap of treating engagement rate as an end in itself rather than as a proxy for audience quality and commercial influence. Quality-focused evaluation asks different questions: who is engaging, what's their relationship to your target customer profile, and does their engagement correlate with the downstream actions your campaign is designed to drive. An account with 3% engagement from highly qualified audience members beats one with 7% engagement from people who will never enter your purchase funnel.
The Engagement Bait Problem
Engagement rate can be gamed. Controversial takes that spark arguments, obvious questions that generate low-effort comments, and engagement bait tactics all inflate the percentage without increasing actual audience influence or commercial value.
Brands that evaluate partnerships on aggregate engagement rate without examining the quality of that engagement end up paying for activity, not influence. A creator whose highest-engaging posts are generic motivational content attracting an audience with no alignment to your brand category has an engagement rate that is technically real and strategically meaningless.
This is why authenticity in influencer marketing is a measurable variable, not a vague brand preference. The composition of engagement, what people are saying, what they're saving, and whether they're asking purchase-intent questions, tells you far more than the aggregate rate.
Follower Quality Audits
Engagement rate is calculated against follower count, but not all followers contribute equally. Bots don't buy products. Inactive accounts don't become customers. People who followed a creator for a giveaway three years ago and haven't engaged since still inflate the denominator and suppress the engagement rate, without representing real audience influence.
This creates a structurally misleading signal for brand marketers. A creator with a clean, actively engaged audience of 25,000 will often show a lower engagement rate than a creator with 60,000 followers, 35% of whom are inactive or inauthentic. The first creator's audience is worth more. The calculator says otherwise.
Follower quality audits, examining the ratio of active to inactive followers, the percentage of suspicious accounts, and the authenticity of engagement patterns, are the only way to evaluate calculating engagement rate in a way that reflects actual audience influence.
Correlation vs. Causation in Engagement Metrics
High engagement rates correlate with audience interest. They don't cause business results.
Brands that invest resources in optimizing for marginal engagement rate improvements on creator selection criteria can end up making zero impact on campaign outcomes. An influencer marketing program built on engagement rates as the primary selection criterion will consistently underperform one built on audience alignment, content fit, and verified follower quality.
Track engagement rate instagram signals as one input into a larger evaluation framework. Connect them to outcomes that matter: conversion behavior, purchase intent signals in comments, save rates on product-adjacent content, and the demonstrated ability of a creator's audience to take commercial action.
Alt text: Engagement quality versus quantity comparison
Time-Based Engagement Patterns That Reveal Content Fit
When engagement happens tells you as much as how much engagement happens. Content that generates immediate engagement behaves differently than content that accumulates engagement over days or weeks. Time-based engagement patterns reveal whether a creator produces impulse-engaging content (quick reactions to timely or entertaining material) or value-engaging content (sustained interaction with educational or reference material).
Both patterns can produce identical overall engagement rates. But they indicate fundamentally different relationships with an audience and suggest different brand partnership approaches. Knowing how to calculate engagement rate in a time-aware way transforms your evaluation from a static snapshot into a dynamic picture of how creator-audience relationships actually function.
First Hour Engagement as a Predictor
Instagram makes critical distribution decisions based on early engagement signals. The first hour after posting matters disproportionately. A creator getting 2% in the first hour and another 2% trickling in over a week is algorithmically different from one getting 0.5% in the first hour and building to 4% over time.
First-hour engagement rate predicts whether Instagram will amplify content beyond the creator's immediate followers. For brand partnerships where earned reach matters, a creator with strong first-hour performance is structurally more valuable than one with equivalent final engagement rates but weak early signals.
Engagement Half-Life and Content Longevity
Some content has a short engagement half-life. It gets most of its engagement in the first 24 hours, then drops sharply. Educational content, tutorials, and reference material tend to have longer half-lives. People save them, return to them, and share them when the information becomes relevant.
For brands investing in sponsored content that communicates complex product benefits or positions a brand in a considered-purchase category, a creator with high save rates and long engagement half-lives is a categorically better partner than one whose content spikes and fades. The first creator's audience keeps receiving the brand message long after the post goes live.
Example: A career coach posts Monday through Friday on professional development. Her average engagement rate is 3.8%. Posts on weekdays drive consultation bookings at 4 times the rate of identical content posted on weekends, when her audience is primarily job seekers rather than corporate professionals. Her weekday engagement rate is lower in percentage but higher in qualified audience value. A brand evaluating only her aggregate rate would miss the critical insight: when she posts is as important as how many people engage.
The Follower Count Paradox Nobody Talks About
Traditional engagement rate calculations create a mathematical paradox where growing a follower count can actively hurt engagement rate, even when growth is healthy and strategic. Successful audience growth often correlates with declining engagement rates, which looks like failure if you're only watching the percentage.
This paradox leads brands to make perverse partnership evaluations, passing on creators in healthy growth phases whose metrics look like decline, while selecting creators with stable but stagnant audiences because their numbers appear consistent.
Why Growth Phases Tank Engagement Rate
A creator runs a successful campaign and gains 5,000 followers in a week. Their engagement rate drops by 30%. This appears to be a red flag. It's often just math.
New followers haven't developed a relationship with the content yet. Instagram won't show posts to all of them immediately. The denominator (followers) jumps immediately. The numerator (engagements) catches up gradually. During that transition, engagement rate looks terrible while the creator's actual audience and influence are expanding.
For brands evaluating influencer marketing for startups or any growth-stage brand category where creator momentum matters, dismissing a creator based on a temporary growth-phase engagement dip is a systematic evaluation error.
The Reach-to-Follower Ratio Reality
Instagram shows content to a fraction of followers, and that fraction shrinks as follower count grows. An account with 1,000 followers might reach 40% of them per post. An account with 100,000 followers might reach 5%. Both accounts could have identical content quality, but the larger account's engagement rate will be structurally lower because the denominator is enormous while actual reach is a small percentage.
This is why engagement rate calculations based on followers rather than reach systematically penalize scale. A 10,000-follower creator with 6% engagement and a 100,000-follower creator with 3% engagement may be performing identically on a per-impression basis.
Engagement Rate Bands by Follower Tier
Different follower tiers have different typical engagement rate ranges, and comparing across tiers produces misleading evaluations.
Micro-influencers (1,000 to 10,000 followers) often see average engagement rate on instagram benchmarks of 5 to 10% because they have intimate audience relationships and high reach percentages. Mid-tier accounts (10,000 to 100,000 followers) typically drop to 2 to 5%. Large accounts (100,000 and above) often settle into 1 to 3%.
These are not quality judgments. They are mathematical realities of how reach scales with follower count. The mathematical reality of why micro-influencers drive proportionally higher ig engagement is structural, not a signal that larger creators are performing poorly.
When benchmarking a creator's performance, always compare within their follower tier. Comparing a 50,000-follower account's 3% engagement rate to a 5,000-follower account's 8% rate tells you nothing useful. They are operating under different mathematical constraints.
Calculating Engagement Rate by Content Type
Aggregating engagement rates across all content types obscures critical performance differences. A Reel about a brand's category performs differently than a carousel, which performs differently than a single-image post. Calculating separate engagement rates for each content type and topic reveals where a creator's audience is most engaged, and whether that high-engagement content overlaps with your brand's campaign objectives.
Content Type Performance Analysis Template (for brand partner evaluation)
Format: [Reels / Carousel / Single Image / Video]
Topic Category: [Educational / Entertainment / Behind-the-Scenes / Promotional]
Average Engagement Rate: %
Engagement Breakdown: Likes: ____ / Comments: ____ / Saves: ____ / Shares: ____
First Hour Engagement Rate: %
7-Day Engagement Rate: %
Save-to-Like Ratio: ____
Alignment with Brand Category (1 to 10): ____
Decision: [] Priority Partner [] Conditional [] Pass
Reels vs. Static Posts Engagement Math
An instagram engagement calculator that treats Reels and static posts the same is producing distorted comparisons. Reels generate plays, which inflate engagement numbers relative to static posts. A Reel with 10,000 plays, 200 likes, and 10 comments shows 10,210 total engagements. A static post with 200 likes and 10 comments shows 210. The Reel's engagement rate will be dramatically higher, but this does not mean it's 48 times more valuable to a brand sponsorship.
Track Reels and static posts with format-appropriate metrics. For Reels: plays, completion rate, likes, comments, saves, shares. For static posts: likes, comments, saves, shares. Then calculate engagement rates within each format rather than across formats. This reveals which content type a creator's audience actually responds to, and which type should anchor your deliverable requirements.

Alt text: Save to like ratio analysis chart
Educational vs. Entertaining Content Performance
Educational content tends to generate more saves and fewer likes. People bookmark it for future reference but don't always engage immediately. Entertaining content generates immediate likes and comments but fewer saves. If you're using an instagram engagement calculator that counts all interactions equally, you're missing a critical distinction for brand partnership evaluation.
A sponsored educational carousel with 50 likes and 30 saves may drive significantly more downstream action than an entertaining Reel with 200 likes and 5 saves, even though the Reel's engagement rate looks stronger. For brands in considered-purchase categories, financial services, health, education, or technology, the save-heavy educational format typically produces stronger brand recall and conversion intent.
Topic-Based Engagement Clustering
Within any creator's content strategy, some topics consistently outperform others. When calculating engagement rate for brand evaluation purposes, break down performance by topic cluster, not just by format.
A creator might average 6% engagement on content about your brand's category, 4% on adjacent lifestyle content, and 2% on off-category posts. Their overall rate of 4% tells you nothing about how their audience responds to brand-relevant content. The topic breakdown tells you everything about partnership fit.
What Your Save-to-Like Ratio Actually Tells You
The ratio between saves and likes reveals more about content value and audience intent than either metric alone. High save rates indicate reference-worthy content that people want to return to, suggesting educational authority and genuine expertise in a subject area. High like rates without corresponding saves suggest entertaining but disposable content.
For brand partners, save-to-like ratio correlates with different business outcomes. High-save content drives authority and long-term audience relationships. High-like content drives reach and visibility. Both have value, but they serve different campaign objectives and should be evaluated accordingly.
Saves as a Leading Indicator of Value
Saves represent a higher commitment than likes. Someone who saves a post is signaling that this content has enough value to revisit, and Instagram's algorithm recognizes this by weighting saves heavily in distribution decisions.
Accounts with high save-to-like ratios above 0.15, meaning 15 saves per 100 likes, are producing content audiences perceive as having lasting value. For brands looking to position themselves as authoritative in a category or drive research-phase consideration, partnering with high-save creators produces compounding brand exposure as audiences return to and share that saved content over time.
Accounts with low save-to-like ratios below 0.05 may be entertaining but aren't creating reference material. Engagement rates on engagement rates alone will miss this entirely.
The Content Library Strategy
High-save content builds a compounding asset. People return to it, share it when it becomes contextually relevant, and reference it in conversations. If a creator consistently produces content with save-to-like ratios above 0.20, their library continues generating brand exposure for sponsored posts long after the initial campaign period ends.
Contrast this with a strategy built entirely on trending audio and timely content. Engagement looks strong during the cycle, then drops to zero once the trend passes. Brands sponsoring trend-dependent creators are renting a moment. Brands sponsoring high-save creators are investing in a sustained presence in an audience's ongoing reference material.
Most effective creator partnerships include both: timely content for reach and visibility, evergreen content for authority and long-term value. Evaluating save rates separately from overall engagement rates is the only way to understand which type of creator you're actually working with.
Using Engagement Velocity Instead of Static Rates
Engagement velocity measures how quickly engagement accumulates rather than just the total amount. Two creators with identical final engagement rates might have completely different velocity curves, and those curves reveal different things about content resonance, algorithmic favor, and audience behavior patterns that matter for brand partnerships.
Fast velocity (high engagement in the first few hours) signals content that resonates immediately and earns algorithmic amplification. Slow velocity (engagement that builds gradually over days) signals content with staying power but limited viral potential. Knowing which pattern characterizes a creator's performance informs which campaign types they're best suited to execute.
The First 60 Minutes Matter Most
Instagram makes distribution decisions within the first hour of posting. High engagement velocity during this window triggers expanded reach to non-followers, which is the mechanism through which brand sponsored content earns earned media value beyond the creator's existing audience.
A brand evaluating two creators with identical aggregate engagement rates needs to know whether those rates are driven by strong early performance that earned platform amplification, or slow accumulation limited to existing followers. The first creator's sponsored content will reach more people organically. The second creator's content performs comparably within their audience but earns less incremental reach.
Sustained vs. Spike Engagement Patterns
Spike patterns (high velocity that drops quickly) work well for timely content, product launches, and reach-focused campaigns where the goal is maximum exposure in a defined window.
Sustained patterns (moderate velocity that continues for days or weeks) work well for brand-building content, category education, and consideration-phase campaigns where repeated audience exposure to the message drives cumulative impact.
An instagram engagement calculator gives you the same final number for both patterns. The strategic implications for brand partnership selection are completely different. Matching a creator's engagement velocity pattern to the campaign's objective, reach vs. sustained consideration, is one of the most underutilized levers in influencer program optimization.
Velocity as a Content Testing Tool
Engagement velocity gives you faster feedback on creator-brand content fit than waiting for final engagement rates. Content that is going to perform well usually shows strong signals within the first few hours. This is particularly valuable when running creator test programs before scaling investment.
Evaluating first-hour engagement rate separately from overall engagement rate, and tracking whether that early signal predicts final performance consistently, tells you whether a creator's audience is primed to respond to content relevant to your brand category. A creator whose audience moves quickly on content adjacent to your product category is a fundamentally different partnership asset than one whose audience accumulates engagement slowly regardless of topic.
Building a Custom Framework for Brand Partnership Evaluation
Generic instagram engagement rate calculator tools serve generic purposes. They won't tell you whether a specific creator is the right partner for a specific brand's campaign. Building a custom engagement framework means identifying which engagement signals matter most for your campaign objectives, weighting them accordingly, and tracking metrics that actually correlate with your desired outcomes.
A brand focused on driving website traffic should weight link clicks and profile visits differently than a brand focused on category authority through comment quality and saves. A direct-to-consumer brand needs different engagement metrics than a B2B company using B2B influencers to reach decision-makers. The measurement framework should follow the campaign strategy, not the other way around.
Engagement Segmentation Audit Checklist (custom framework build)
- Define your primary campaign objective: reach, consideration, conversion, or retention
- Identify which engagement signals correlate with that objective based on your historical campaign data
- Assign relative weights to each signal type (saves, comments, shares, link clicks, DM-driven actions)
- Calculate a weighted engagement score for each creator you evaluate using the formula: (Likes x 1) + (Comments x 2) + (Saves x 3) + (Shares x 5) + (Profile Visits x 4) + (Link Clicks x 10), then adjust weights to match your specific goal hierarchy
- Compare weighted scores against standard engagement rates to identify creators who are systematically undervalued by generic calculators
- Track whether weighted engagement scores from the evaluation phase predict actual campaign performance
- Refine weights each cycle based on what you observe converting
Identifying Your Core Engagement Signals
Not all engagement serves brand goals equally. Mapping your conversion path first, identifying what actions people need to take to move from audience member to customer, determines which engagement signals you should weight most heavily.
For a brand selling a considered-purchase product, saves and detailed comments asking product-specific questions are high-intent signals. For a brand driving event registration, profile visits and link-click rates matter most. For a brand building long-term category presence, comment quality and recurring engagement from the same accounts (indicating genuine relationship-building by the creator) are the meaningful metrics.
Influencer collaboration pricing tied to these custom signals will consistently outperform rates tied to aggregate engagement percentages because you're paying for demonstrated performance on the variables that actually move your business.
Conversion-Adjusted Engagement Rates
The ultimate custom metric is conversion-adjusted engagement rate: the percentage of creator-audience engagement that leads to actions beyond the platform.
Tracking which creator posts drive profile visits, link clicks, email signups, or purchase behavior, then calculating engagement rates that only count engagement from posts that drove conversions, reveals whether you're investing in content that influences or content that entertains without converting.
This same conversion-adjusted approach should anchor how brands measure ROI from influencer marketing for D2C brands, where the attribution chain from creator post to purchase needs to be airtight to justify program investment.
You might find that a creator's highest-engagement posts are their lowest-converting posts. They generate activity from an audience that will never enter your funnel. Meanwhile, their moderate-engagement posts convert at 5 times the rate because they attract a more qualified audience segment. That insight, invisible to any standard engagement rate calculator, is the difference between an efficient program and a wasteful one.
Weighted Engagement Formulas
Engagement Score = (Likes x 1) + (Comments x 2) + (Saves x 3) + (Shares x 5) + (Profile Visits x 4) + (Link Clicks x 10)
These weights are a starting point, not a prescription. For a consultant category, meaningful comments may deserve higher weight than saves. For an e-commerce brand, link clicks may be worth 20 times likes. Your weights should reflect what actually drives pipeline for your specific business model.
Divide your weighted engagement score by reach (not followers) to produce a quality-adjusted metric that measures what actually matters for your partnership investment. This engagement rate calculator instagram output won't be comparable to anyone else's benchmarks, but it will consistently identify which creators are generating real commercial influence versus producing engagement theater.
Track this custom metric alongside standard engagement rate. When they diverge, you're learning something important about whether your evaluation criteria are aligned with your campaign outcomes. A creator whose standard rate is rising but whose weighted rate is flat is producing more activity without improving audience quality. That's a critical signal before scaling spend.
Segment-Specific Engagement Tracking
Different audience segments have different commercial value to your brand. Engagement from your exact target customer is worth more than equivalent engagement from adjacent audiences, regardless of what the aggregate rate shows.
For influencer marketing for D2C brands in particular, where customer acquisition cost and lifetime value are the governing metrics, identifying creators whose audiences concentrate in your high-value segments produces dramatically better program economics than selecting on aggregate engagement rate alone.
Create segment-specific engagement rates by tracking engagement from target-profile accounts separately from overall engagement. This requires more manual evaluation or a platform capable of audience intelligence at the account level, but it produces the only version of engagement rate that reliably predicts whether a partnership will generate real business outcomes.
A 2% free instagram engagement rate calculator output from highly qualified prospects in your target segment beats a 6% rate from people who will never convert. Build your evaluation system to see that difference.
What Engagement Data Is Actually For
Your Instagram engagement rate is a number. What that number means depends entirely on how you calculate it, what you compare it to, and whether it connects to the outcomes your brand is trying to drive.
The accounts generating real influencer marketing ROI aren't the ones with the highest ig engagement rate on their creator roster. They're the ones who understand what drives specific engagement, which engagement signals correlate with their campaign goals, and how to evaluate creators on the variables that predict performance rather than the variables that are easiest to measure.
For brands managing serious influencer investment, the framework described above is achievable manually for small programs. At scale, across dozens of active partnerships and hundreds of creators in evaluation, the data requirements for verifying audience quality, analyzing engagement by content type and segment, and tracking conversion-adjusted performance exceed what spreadsheet-based evaluation can produce.
SPIRRA's platform is built to surface this intelligence automatically: True Follower verification that separates real engaged audiences from inflated counts, Brand Alignment Scores and Content Alignment Scores that predict partnership fit before you commit budget, and real-time analytics that connect social media engagement rate signals to actual campaign outcomes. Across 19 million influencers and 150 data points per creator, the platform makes verified audience intelligence and engagement quality measurable at the scale enterprise programs require. If your Instagram influencer strategy is running on aggregate engagement rates from a generic calculator instead of verified audience intelligence, request a demo to see what the data actually shows.