

ROAS Calculator
Platform-reported ROAS is a starting point, not a conclusion. The number your ad dashboard shows you is accurate for what it measures — and systematically incomplete about what actually matters. Attribution overlap, untracked costs, short attribution windows, and missing CLV adjustments are baked into every standard ROAS calculation, including the ones your board is currently reviewing.
Understanding what goes into a rigorous ROAS calculation will change how you evaluate every campaign you run — and almost certainly reveal that some of your highest-reported campaigns are underdelivering, and some of your lowest are your most valuable.
TL;DR
- Most ROAS calculators fail because they ignore attribution overlap, leading to inflated returns across platforms
- Revenue recognition timing creates false positives, especially for subscription or high-consideration products
- Cost inputs should include creative production, testing budgets, and platform fees — not just media spend
- Short attribution windows (7-day, even 30-day) systematically undervalue campaigns that drive long-term customer relationships
- Platform reporting discrepancies mean your Facebook ROAS and Google ROAS are measuring different things entirely
- Lifetime value integration transforms ROAS from a vanity metric into a genuine profitability indicator
- Some campaigns with "poor" ROAS drive the highest-value customers — a reality standard calculators can't surface
- The calculator above includes fields for these hidden variables — use it to stress-test your current numbers
- ROAS should inform budget allocation, not dictate it — context matters more than the ratio itself
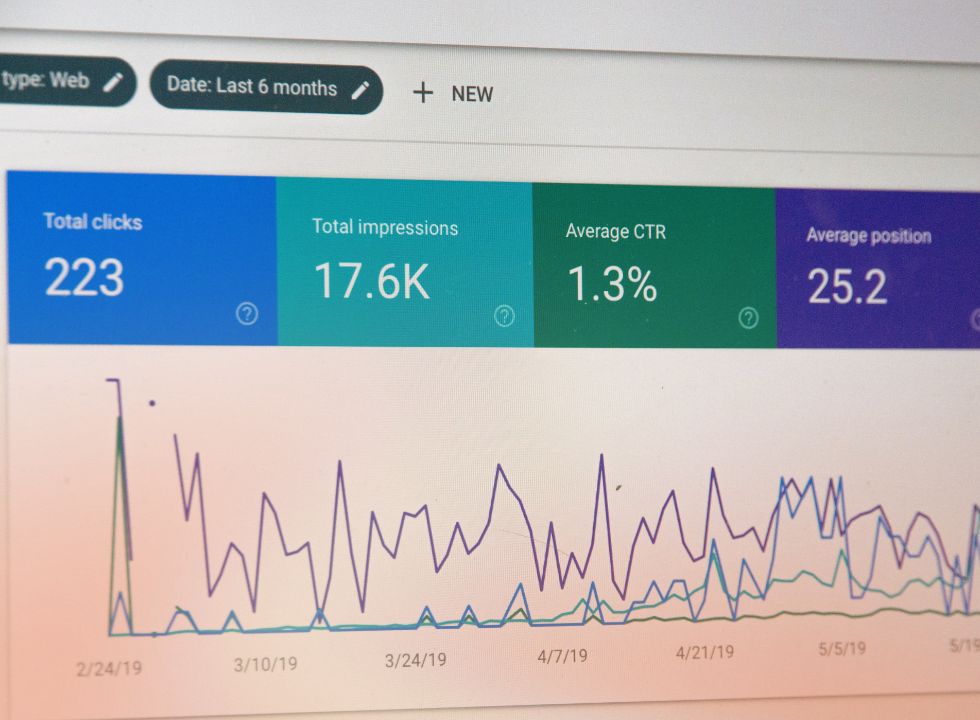
The Attribution Blindspot That Skews Every ROAS Calculation
Why Multi-Touch Attribution Breaks Simple ROAS Math
Standard ROAS calculators ask for ad spend and revenue. You plug in $10,000 spent and $40,000 earned, and you get a clean 4:1. The problem shows up when you run this across Facebook, Google, and your email platform, and suddenly you've "generated" $120,000 from $30,000 in spend. Each platform claims credit for the same conversions.
The core issue is attribution overlap. When multiple platforms claim credit for the same conversion, you end up with inflated performance metrics across your entire marketing stack. This isn't a minor discrepancy — it fundamentally misrepresents which channels are actually driving growth. A customer sees your Facebook ad, searches your brand, clicks a Google ad, then converts. Facebook says it drove the sale. Google says it drove the sale. Both are technically correct within their own models. Your actual ROAS is half what the sum of their reports suggests.
You can't fix this with better tracking pixels. The issue is structural. The ROAS calculator above includes attribution weighting fields that address this directly — letting you assign partial credit across touchpoints rather than accepting platform-reported numbers at face value. This is exactly the kind of measuring influencer marketing ROI challenge that applies to every paid channel, not just creator partnerships.
Deduplication Strategies Most Calculators Ignore
The calculator above asks you to input not just revenue, but to indicate whether you're using first-click, last-click, or weighted attribution. This matters enormously. If you're pulling last-click data from Google Analytics but comparing it to Facebook's default attribution window (which includes view-throughs), you're comparing incompatible datasets.
| Attribution Model | How It Works | Best Use Case | Typical ROAS Impact |
| First-Click | Credits the first touchpoint in the customer journey | Understanding which channels drive initial awareness | Favors top-of-funnel campaigns; often shows 20–40% lower ROAS than last-click |
| Last-Click | Credits the final touchpoint before conversion | Quick decisions, direct response focus | Inflates retargeting and branded search ROAS by 30–60% |
| Linear | Distributes credit equally across all touchpoints | Balanced view of multi-touch journeys | Most conservative; typically 15–25% lower than last-click |
| Time-Decay | Gives more credit to touchpoints closer to conversion | Sales cycles where recent interactions matter most | Similar to last-click but slightly more balanced |
| Position-Based | 40% to first and last touch, 20% to middle | Understanding both awareness and conversion drivers | Moderate; balances top and bottom funnel |
The key insight isn't about picking the "right" model — it's about understanding which one you're currently using and staying consistent. Marketing teams argue for hours about whether a campaign "worked" when the real issue is that one person is looking at 1-day post-click and another is looking at 28-day post-view. Both numbers are accurate. Neither is useful for decision-making.
The View-Through Problem
View-throughs are conversions attributed to users who saw your ad but didn't click. Some platforms count these automatically. Others don't. If your calculator doesn't let you separate click-based revenue from view-based revenue, you're blending two fundamentally different types of influence.
View-throughs tend to inflate ROAS because they capture people who were already likely to convert. They saw your ad, but they also saw twelve other things that day. Attributing their purchase entirely to your ad spend overstates your impact. The calculator above includes a toggle for this. Use it.
What Your Current Calculator Isn't Measuring (And Should Be)
The Incrementality Gap
ROAS tells you correlation. It doesn't tell you causation. A customer who converts after seeing your ad might have converted anyway. This is the incrementality problem — and almost no standard ROAS calculator accounts for it.
Incrementality is the difference between what happened with your ads running and what would have happened without them. Standard ROAS calculations assume every attributed conversion was caused by the ad, which is rarely true. Incrementality testing — through holdout groups, geo experiments, or PSA tests — is the only way to know your true return. If your test shows that 40% of conversions would have happened anyway, your effective ROAS is significantly lower than your reported figure. The calculator above includes an incrementality adjustment field where you can input your lift percentage to see your true return.
Example: A DTC furniture brand was celebrating a 5:1 ROAS on their Facebook prospecting campaigns. They ran a geo-holdout test, turning off ads in three matched markets for 30 days. Sales in the holdout markets dropped by only 35%, meaning 65% of their attributed conversions happened regardless of ad exposure. Their true incremental ROAS was 1.75:1, not 5:1. They were still profitable — but nowhere near as profitable as their platform reports suggested. This discovery shifted their entire budget allocation strategy, pulling back on Facebook spend and reinvesting in channels with higher incrementality.
Running incrementality tests is hard. Most brands don't do it. But even a rough estimate — assuming 30% of your conversions are incremental — will give you a more honest picture than accepting platform-reported numbers at face value.
Brand Halo Effects That Don't Show Up in Direct Response Metrics
Your prospecting campaigns might show 2:1 ROAS while retargeting shows 8:1. Standard logic says to cut prospecting and pour everything into retargeting. That logic is backwards.
Retargeting performs well because prospecting created the audience. When you calculate ROAS for each campaign in isolation, you miss this dependency entirely. "Assisted ROAS" frameworks account for the full customer journey — attributing some retargeting success back to the top-of-funnel campaigns that made it possible. The calculator above includes fields for both direct and assisted revenue, so you can see how your top-of-funnel spend contributes to bottom-funnel conversions.
You can test this yourself by pausing prospecting for a month. Watch what happens to retargeting performance. It tanks. The ROAS you were celebrating was dependent on the "underperforming" campaigns you just cut.
The Revenue Recognition Problem Nobody Talks About
Subscription Models and Delayed Revenue
If you sell subscriptions, your ROAS calculation is probably wrong. You're counting the first month's payment as revenue, but your ad spend was an investment in a customer who will — hopefully — pay you for twelve months or more.
Using first-month revenue in a ROAS calculator dramatically understates performance. The right approach is to use expected lifetime value in the revenue field, not the initial transaction. The calculator above includes a subscription mode that lets you input average customer lifetime and retention rate to calculate a more accurate return. This applies to any business with repeat purchases. If your customers buy multiple times, your ROAS should reflect that — otherwise you're systematically underinvesting in acquisition because the math looks worse than it actually is.
A campaign showing 1.5:1 ROAS based on first-purchase revenue might actually be a 6:1 return when you account for repeat purchases over the next year.
High-Consideration Purchases and Long Sales Cycles
B2B and high-ticket B2C products have the opposite problem. Revenue shows up months after the ad spend. Your ROAS looks terrible in the short term because you're measuring cost against zero revenue.
Cohort-based ROAS calculations match ad spend with the revenue it eventually generates, even when that revenue is delayed. The calculator includes a time-lag adjustment where you can specify your average sales cycle and see projected ROAS based on historical close rates. Without this adjustment, you're flying blind for months after launch.
Example: A B2B SaaS company selling enterprise software at $50,000 annual contracts was evaluating paid search campaigns after 60 days and seeing 0.3:1 ROAS. They were about to shut everything down. When they extended analysis to 180 days and matched ad clicks to closed deals in their CRM, the picture changed completely. Their actual ROAS was 4.2:1 — but it took an average of 127 days from first click to closed deal. By implementing cohort-based tracking that matched monthly spend to revenue that closed 4 to 6 months later, they could finally evaluate campaign performance accurately and scaled budget by 300%.
Cost Inputs: Where Most Marketers Accidentally Inflate Their Returns
The Hidden Costs That Should Be in Your Denominator
Your ROAS calculator asks for "ad spend." You enter the number from your ad platform. You're missing half your actual costs.
True cost of acquisition includes more than media spend. Creative production, agency fees, platform subscriptions, testing budgets, and the salary of the person managing the campaigns should all be factored in. Understanding influencer collaboration pricing as a model makes the principle clear: every channel has fully-loaded costs that extend well beyond the direct payment line, and accurate ROAS requires accounting for all of them. The calculator above has an expanded cost section with fields for creative, management, tools, and overhead. When you include these, your ROAS will look lower — but it will be accurate. Most brands discover they're not as profitable as they thought. That's painful but necessary information for making smart allocation decisions.
Complete ROAS Cost Checklist:
- Direct ad spend (platform reported)
- Agency management fees (% of spend or flat retainer)
- Creative production costs (video, static, copy)
- Creative testing budget (failed ads and experiments)
- Platform subscription fees (ad management tools, analytics)
- Attribution and tracking software costs
- Internal team salary allocation (hours spent × hourly rate)
- Freelancer or contractor fees (designers, copywriters, strategists)
- Landing page development and optimization costs
- A/B testing tools and conversion optimization software
- Data analysis and reporting time
- Training and education expenses
If you're paying an agency 20% of spend, your $10,000 campaign actually costs $12,000. If you spent $2,000 on creative you're running across multiple campaigns, that cost needs to be allocated proportionally across each of them.
Testing Costs and Failed Experiments
You launched ten campaigns. Nine failed. One worked and now has a 5:1 ROAS. If you only calculate ROAS for the winning campaign, you're ignoring the $9,000 you burned to find it. The true cost of a successful campaign includes all the failed experiments that preceded it. "Blended ROAS" across your entire testing program — not just the winners — is the honest measure. If you only measure the successes, you'll think you're profitable when you're actually losing money overall. The calculator includes a total testing budget field so you can see your true blended return across all experiments, not just the campaigns you decided to scale.

Time Windows and Why Your 7-Day ROAS Means Almost Nothing
Attribution Window Mismatch Across Platforms
Facebook defaults to 7-day click, 1-day view. Google Ads uses 30-day click for search, 1-day for display. TikTok varies by settings. When you calculate ROAS for each platform using their default windows, you're not comparing equivalent metrics — and every budget allocation decision you make based on that comparison is comparing incompatible numbers.
| Platform | Default Attribution Window | Click vs. View | What This Means for ROAS |
| Facebook/Meta | 7-day click, 1-day view | Both counted | Inflates ROAS through view-through conversions, often 15–30% higher than click-only |
| Google Search | 30-day click | Click only | More conservative; captures longer consideration cycles |
| Google Display | 1-day click, 1-day view | Both counted | Severely undervalues campaigns; misses most assisted conversions |
| TikTok | 7-day click, 1-day view (default) | Both counted | Similar to Facebook but with less sophisticated tracking |
| 30-day click | Click only | Better for B2B long cycles; still misses view-through influence | |
| 30-day click, 30-day view | Both counted | Most generous attribution; often shows highest ROAS of any platform |
The calculator above lets you specify the attribution window you're using so you can compare apples to apples. This is basic — but it's shocking how many budget allocation decisions are made on incompatible data.
Why Longer Windows Matter More Than You Think
A 7-day attribution window systematically undervalues campaigns that drive consideration rather than immediate conversion. If your product requires research or has a long purchase cycle, short windows will make your top-of-funnel campaigns look ineffective even when they're working perfectly.
Determine the right attribution window for your business based on your actual customer journey data — not platform defaults. If it takes your customers an average of 21 days to convert, a 7-day window captures less than half the picture. The calculator includes preset options for 7, 14, 30, 60, and 90-day windows, plus a custom field. ROAS changes dramatically as you extend the window. That shift isn't inflation — it's accuracy.
Platform-Specific Quirks That Break Standard Formulas
iOS 14.5 and the Data Void
Post-ATT, Facebook's conversion tracking is modeled, not measured. Your ROAS calculation is based on statistical estimates, not actual tracked conversions. Google faces similar challenges with consent mode and cookie deprecation. The data you're feeding into your ROAS calculator is increasingly estimation rather than direct tracking.
Server-side tracking, conversion APIs, and first-party data collection are the structural responses to this shift. The calculator includes a data confidence field where you can indicate what percentage of your conversions are tracked versus modeled. If 60% of your conversions are modeled, your ROAS is an educated guess, not a fact. That doesn't make it useless — but it should inform how much confidence you place in the number and how aggressively you act on it.
Amazon and Retail Media Networks
Amazon attributes conversions differently than Facebook or Google. They track the entire customer journey within their ecosystem, which means they can see conversions that other platforms miss. But they also attribute conversions to ads that may have had minimal influence.
Retail media networks operate in walled gardens with their own attribution logic — and their own incentives to make their ad products look as effective as possible. The calculator includes a retail media mode that accounts for the unique characteristics of these platforms, including their access to full purchase history and their tendency to claim credit for purchases that would have happened anyway.
Building a Calculator That Accounts for Customer Lifetime Value
Why CLV-Adjusted ROAS Is the Only Metric That Matters
A customer who spends $100 once and a customer who spends $20 per month for three years both show up identically in a standard ROAS calculation if you're only measuring first purchase. That's an absurd equivalence to build budget decisions around.
CLV-adjusted ROAS replaces first-purchase revenue with expected lifetime value in your formula. The result is a metric that reflects long-term profitability rather than short-term transaction value. The calculator includes CLV fields where you can input average customer lifetime, purchase frequency, and retention rate. It then shows standard ROAS and CLV-adjusted ROAS side by side. The same principles that make analyzing ROI from influencer marketing require a long-term lens apply to every acquisition channel where customer value extends well beyond the first transaction.
A campaign with 2:1 first-purchase ROAS might actually be a 7:1 return when you account for the full customer relationship. That changes everything about how you allocate budget.
Segmenting ROAS by Customer Quality
Not all customers are worth the same. Some churn immediately. Others become brand advocates who refer friends and stick around for years. Your ROAS calculation should help you identify which campaigns attract which type of customer.
Segmented ROAS analysis calculates separate returns for different customer cohorts based on long-term value. Tag customers by acquisition source, then track their behavior over time to see which campaigns generate the highest-quality customers. A campaign that acquires customers with 80% retention is fundamentally different from one that acquires customers with 20% retention — even if immediate ROAS looks identical. The calculator includes cohort comparison tools that let you input retention rates and average order values by segment. Often, the campaigns that look mediocre on paper are bringing in your best long-term customers.
The Retention Rate Variable
Retention is the multiplier that turns a decent ROAS into an exceptional one. If you acquire a customer for $50 and they spend $100 in month one, you have a 2:1 return. If they stick around and spend $100 per month for a year, you have a 24:1 return on the same acquisition cost.
The calculator above asks for your average retention rate by month. Plug in your actual numbers — even rough estimates are better than nothing — and watch how dramatically your true ROAS changes. This is why subscription businesses can afford to "lose money" on acquisition. They're not losing money. They're investing in relationships that pay back over time.

When a "Bad" ROAS Is Actually Your Best Performing Campaign
Brand Building vs. Direct Response
Your brand awareness campaign shows 1.2:1 ROAS. Your retargeting campaign shows 9:1. Standard thinking says to kill awareness and double down on retargeting. You'd be making a significant mistake.
Without top-of-funnel awareness, you have no one to retarget. Without brand consideration, conversion rates tank. Blended ROAS across your full funnel — and budget allocated based on the interdependencies between campaign types — is the framework that prevents this mistake.
Example: An apparel brand cut their YouTube brand awareness campaigns because they showed 0.9:1 ROAS while Google Shopping delivered 6:1. Within 45 days, Shopping ROAS dropped to 3.8:1. Branded search volume declined 34%. Retargeting audiences shrank, and those campaigns dropped from 8:1 to 4.5:1. When they reinstated YouTube spend and waited 60 days, all other channels recovered. Their blended ROAS across all channels was actually higher when they included the "unprofitable" brand campaigns.
New Customer Acquisition Costs vs. Retention Costs
Acquiring a new customer costs significantly more than retaining an existing one. Your new customer acquisition campaigns will always show worse ROAS than retention or reactivation campaigns. Optimizing purely for ROAS will cause you to systematically underinvest in growth.
A 2:1 ROAS on new customer acquisition might be excellent if those customers have high lifetime value. An 8:1 ROAS on reactivation might actually be underperforming if you're only bringing back low-value customers. The calculator separates new customer ROAS from existing customer ROAS so you can evaluate each appropriately. For early-stage companies navigating these trade-offs, influencer marketing for startups illustrates how to accept lower initial ROAS to build the customer base that enables future profitability — a principle that holds for every acquisition channel, not just creator partnerships.
Campaign-Type ROAS Target Framework:
New Customer Acquisition (Cold Traffic)
- Target ROAS: 1.5:1 to 3:1
- Acceptable if CLV is 3x+ first purchase value
- Red flag if below breakeven for 90+ days
- Optimization focus: Customer quality over volume
Retargeting (Warm Traffic)
- Target ROAS: 4:1 to 8:1
- Acceptable if audience size remains stable or growing
- Red flag if audience pool is shrinking (indicates top-of-funnel problems)
- Optimization focus: Conversion rate and average order value
Customer Retention / Reactivation
- Target ROAS: 6:1 to 12:1
- Acceptable if retention rate improves or stabilizes
- Red flag if only reactivating low-value customers
- Optimization focus: Lifetime value extension
Brand Awareness
- Target ROAS: 0.5:1 to 2:1 (direct attribution)
- Acceptable if branded search, direct traffic, and organic growth trend upward
- Red flag if no measurable brand lift after 90 days
- Optimization focus: Reach, frequency, and brand recall metrics
Market Expansion and Strategic Losses
Sometimes you need to enter a new market or test a new channel, and you know the ROAS will be terrible at first. That's fine. You're paying for learning and market position, not immediate returns.
The calculator helps you model this. Input your current performance in established channels, then run scenarios for new channel tests with lower expected returns. You can see how much you can afford to "lose" on testing while maintaining overall profitability — turning strategic decision-making into math rather than gut feel.
How to Use This Calculator to Audit Your Current Performance
The Seven Inputs That Change Everything
The calculator above asks for more than just ad spend and revenue. Here's what to fill in and why each field matters:
- Total ad spend — Platform-reported media cost plus all loaded costs (see checklist above). Don't just enter the number from your dashboard.
- Attributed revenue — Deduplicated across platforms using a single, consistent attribution model. Not the sum of what each platform reports.
- Attribution model — Select the model you're actually using. If you haven't consciously selected one, you're using whatever your platform defaulted to.
- Incrementality adjustment — The percentage of conversions that were truly caused by your ads. Even a rough estimate (60 to 70% is a common starting point) gives you a more honest number than 100%.
- Customer lifetime value multiplier — For any business with repeat purchases. Use your actual retention data, or start with a conservative estimate and update as you gather more.
- Data confidence level — What percentage of your conversions are directly tracked versus modeled. This tells you how much to trust the number you're calculating.
- Attribution window — Standardized to match your actual customer journey length, not a platform default.
Running Comparison Scenarios
The real power of a sophisticated calculator isn't in getting one number. It's in running multiple scenarios to understand how different variables affect your returns.
Model different scenarios to stress-test your assumptions: What happens to ROAS if retention drops 10%? How does extending the attribution window change which campaigns look profitable? What if you're overestimating incrementality by 20%? If a small change in retention rate swings your ROAS from 3:1 to 1.5:1, you know that retention is your most critical lever and you should be investing heavily in improving it.
Monthly Audits and Trend Analysis
ROAS isn't static. Your returns will fluctuate based on seasonality, competition, creative fatigue, and a dozen other factors. Run this calculation monthly and track the trends. This helps you spot problems early — like declining incrementality or rising acquisition costs — before they damage profitability. It also reveals seasonal patterns so you can plan budget allocation accordingly.
Integrating ROAS Data Into Broader Business Decisions
ROAS Thresholds for Budget Allocation
You need a target ROAS for each campaign type, but that target should be based on your unit economics — not industry benchmarks. A DTC brand with 70% margins can tolerate much lower ROAS than a retailer with 20% margins.
Determine your breakeven ROAS (the point where you're not making or losing money) and your target ROAS (the return you need to hit profitability goals). Campaigns above target get more budget. Campaigns between breakeven and target are worth continuing but not scaling. Campaigns below breakeven need to be fixed or cut. For D2C brands, influencer marketing for D2C brands shows how this framework applies across channel types — the same logic that governs creator program economics applies to your entire acquisition stack.
The calculator includes a profitability analysis section where you can input your margin and overhead costs to see your breakeven and target ROAS. This turns ROAS from an abstract metric into a concrete decision-making tool.
When to Ignore ROAS Entirely
There are situations where ROAS is the wrong metric to optimize for. If you're pre-revenue and focused on building an audience, ROAS is meaningless. If you're testing a completely new channel or message, short-term ROAS will mislead you.
Alternative metrics — customer acquisition cost, payback period, contribution margin, market share — matter more in specific scenarios. Early-stage companies should care more about learning rate than ROAS. Mature companies in competitive markets might prioritize market share over immediate profitability. The calculator includes a goals section where you can specify what you're optimizing for, and it adjusts output accordingly.
Cross-Functional Communication and Shared Metrics
Your finance team cares about ROAS for different reasons than your marketing team. Finance wants to know if marketing spend is generating profit. Marketing wants to know which campaigns to scale. These are compatible goals that require a shared measurement framework.
Connect ROAS to P&L impact. Forecast revenue based on planned spend and expected ROAS. Build business cases for budget increases using the same numbers your CFO uses. The calculator includes an executive summary output that translates detailed ROAS analysis into high-level business metrics — projected revenue, estimated profit, ROI — in language that finance and executive teams understand. Marketing leaders who need to justify budgets to boards that don't speak in attribution models will find this output valuable for building the business case in numbers that travel up the org.

Building ROAS Into Your Forecasting Model
ROAS shouldn't be a backward-looking metric. Use it to forecast future performance and plan budget allocation. Input planned spend by channel and expected ROAS to project revenue for the next quarter or year. If you know your ROAS trends and your planned spend, you can predict revenue with reasonable accuracy — which feeds cash flow planning, hiring decisions, and inventory management in ways that marketing metrics rarely do.
Most of what this page covers requires pulling data from multiple sources, deduplicating it, and running calculations that update continuously as campaigns run. Doing this in spreadsheets means your numbers are outdated the moment you finish building them.
Most of what this page covers requires pulling data from multiple sources, deduplicating it, and running calculations that update continuously as campaigns run. Doing this in spreadsheets means your numbers are outdated the moment you finish building them.
SPIRRA's audience intelligence platform surfaces the creator-side variables that feed into accurate ROAS calculations — True Follower verification, audience demographic data, engagement quality scoring, and brand alignment signals — so that the creator partnerships in your marketing mix are built on verified audience data, not media kit estimates. The calculator above gives you the framework. SPIRRA gives you the inputs you can actually trust.
If you're spending more than $50k per month on ads and still calculating ROAS manually, you're making budget decisions on stale, incomplete data. Request a demo to see how different your real ROAS looks from what your ad platforms are currently reporting.